How to Measure WordPress Performance After a Redesign
Practical steps to benchmark speed before and after design changes
WordPress performance often changes after a redesign, and you need a clear way to measure it. A fresh layout, new plugins, and extra scripts can all slow things down if you do not benchmark and compare results.
You will see how to run speed tests, track Core Web Vitals, and compare before and after numbers in a simple workflow. The goal is to help you confirm that your redesign looks better, feels faster, and keeps search traffic stable or improving.
Quick Check of WordPress Performance After Redesign
Right after a redesign goes live, you should run a quick health check. Focus on one or two key pages first, such as the homepage and a top landing page. This gives you an early signal if WordPress performance has improved or slipped.
What Should You Measure First
Start with page load time, Largest Contentful Paint, and basic mobile scores. These numbers give you a fast view of how quickly users see and can use your content. If these look worse than before, you know the redesign added weight that you must investigate.
How Soon Should You Test Again
Run tests right after launch, then repeat after a few hours, and again after one or two days. Caches warm up, traffic patterns shift, and DNS changes settle. Repeating tests helps you see whether performance issues are temporary or part of the new design.
Quick Redesign Performance Checklist
- Test homepage and one key inner page on mobile and desktop.
- Compare new scores with your last prelaunch report.
- Confirm that Core Web Vitals are still within green or at least stable.
- Check that caching and CDN still work with the new theme.
This short checklist keeps you from missing obvious problems while you are busy celebrating the new design.
Key Metrics That Actually Matter
Many tools show dozens of numbers, but you only need a small set to track redesign impact. When you focus on a consistent group of metrics, it becomes easier to compare pages and explain changes to clients or stakeholders.
Which Core Web Vitals Matter Most
Largest Contentful Paint, Interaction to Next Paint, and Cumulative Layout Shift are the main signals for user experience. They show how quickly main content loads, how responsive the page feels, and how stable layout is while loading. If these degrade, the redesign needs tuning.
What Server Metrics Reveal
SEO and UX, and where you will see it in daily work.”>Time to First Byte and overall server response time tell you whether hosting or backend code is slowing the new design. Longer TTFB often appears when new plugins, heavy queries, or custom code run before a page is rendered.
How to Track Metrics Over Time
Use a simple spreadsheet or dashboard to log key metrics for each test run. Record the URL, device type, location, test tool, and results. Over time, this helps you spot patterns such as slowdowns after plugin updates or theme changes.
Tools to Test Your New Design
You do not need dozens of tools to measure performance. A mix of one lab testing tool, one real user data source, and your browser’s developer tools is enough for most WordPress sites.
Lab Testing With Speed Tools
Lab tools such as Google PageSpeed Insights, GTmetrix, WebPageTest, and Pingdom let you test from fixed locations with repeatable settings. They show Core Web Vitals, waterfall charts, and resource sizes, which makes it easier to see what changed after a redesign.
Open your browser and visit PageSpeed Insights, then paste your URL and run mobile and desktop tests.
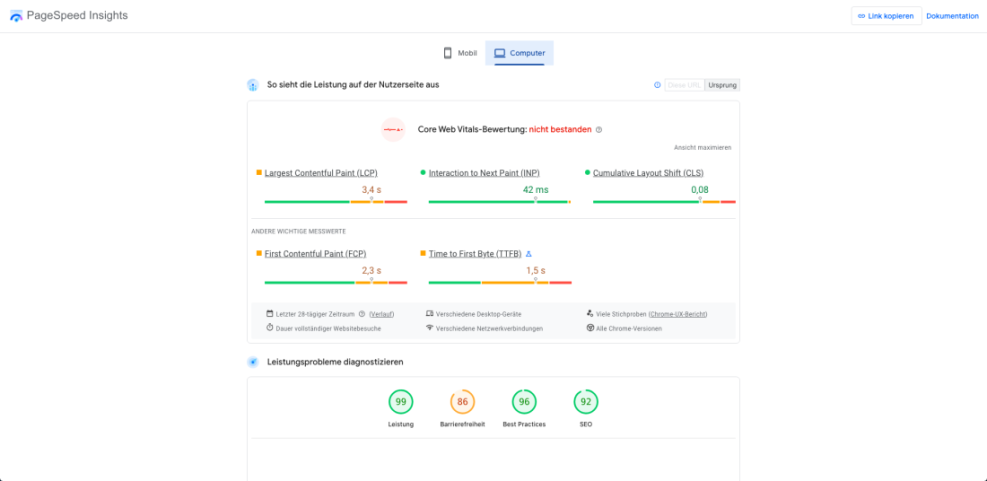
These reports highlight render blocking scripts, unoptimized images, and layout shift so you can see how new design elements behave under load.
Measuring Real User Experience
Field data from sources like Chrome User Experience or your analytics suite tells you how real visitors experience the redesign. While lab scores may look perfect, real user data can reveal slow regions, older devices, and spotty mobile networks that expose weak points.
Should You Pay for Premium Tools
Paid tools that log tests over time and send alerts are helpful for large or high revenue sites. However, most small to mid sized sites get enough value from free versions of PageSpeed Insights and one or two third party testers combined with strong caching.
Benchmarking Before and After Redesign
A redesign project should always include clear before and after benchmarks. When you measure performance early, you can make design choices with data instead of guessing.
How to Create a Prelaunch Baseline
Before any redesign work starts, pick core templates such as homepage, blog post, archive, and key product pages. Run three to five tests per page in your chosen tools, then log the median results. This becomes the baseline you compare against after changes.
- Select the main URLs and note their purpose, such as blog or checkout.
- Run tests on mobile and desktop for each URL using the same tools.
- Record metrics like LCP, INP, CLS, TTFB, and total page size.
- Export or screenshot reports and store them in your project folder.
With a solid baseline, you can say with confidence whether the new design is faster, equal, or slower.
How to Compare Before and After Results
After launch, repeat the exact same tests from similar locations. Then compare baselines with new results for each URL. Focus on relative change instead of chasing a perfect score; a slightly lower grade with better user experience might still be acceptable.
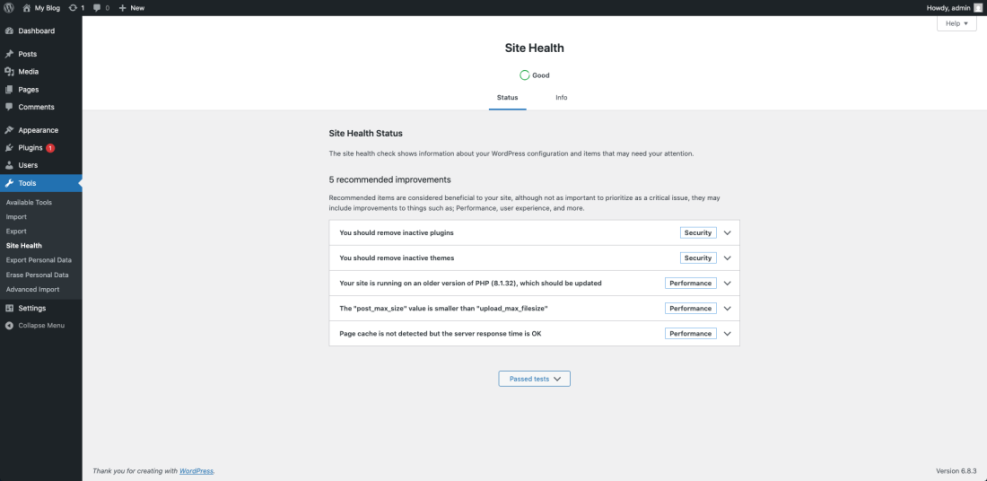
From the WordPress Dashboard, go to Tools » Site Health and review the performance section before capturing your screenshots.
If numbers are worse, note which metrics changed most, then map them back to design or technical changes for targeted fixes.
Testing Critical User Journeys
Speed on the homepage matters, but real visitors move across several pages. Therefore, you must measure complete user journeys such as reading an article, filling out a form, or completing a checkout.
What Pages Should You Test
List the most valuable tasks on your site, such as signing up, requesting a quote, or buying a product. Then identify the pages that form those flows. Test each page in the sequence so you can spot bottlenecks that appear only after a few steps.
How to Simulate Real Traffic Paths
Open an incognito window and navigate your site just like a visitor would, while watching the network panel in DevTools. Pay attention to slow transitions, long spinners, and layout jumps. These issues often appear only when features like search filters or popups load.
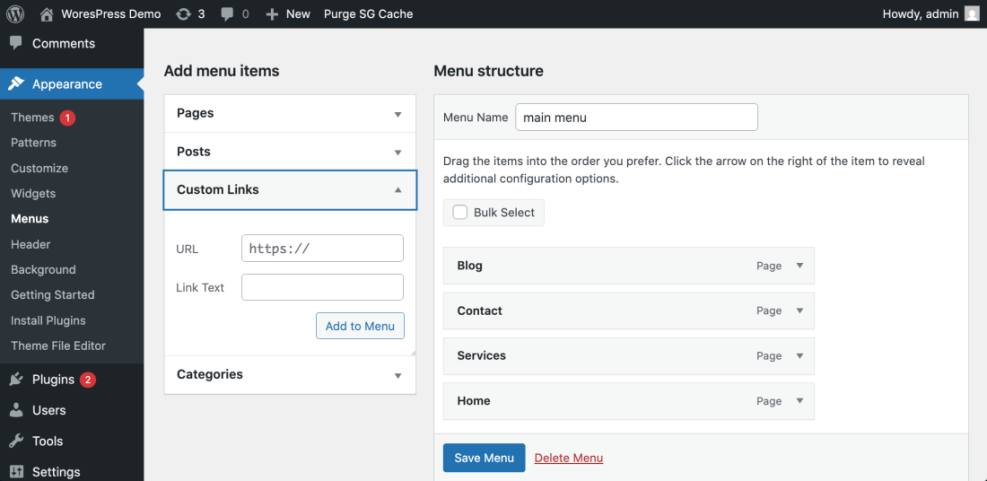
Navigate to Appearance » Menus and open key navigation links in new tabs to test how quickly important sections load.
This approach helps you align your performance tests with real business goals instead of random URLs.
Finding What Slowed Down the Redesign
When scores drop, you need a method to find the cause. Often it is a mix of larger images, extra scripts, and layout changes that push important content down the page.
Spotting Heavy Images and Scripts
Use waterfall charts in your test tools to look for large files and long blocking requests. Overly large hero images, custom fonts, and third party scripts such as chat widgets commonly grow during redesigns. Removing or deferring just one script can restore much of the lost speed.
Diagnosing Layout Shift After Changes
If your CLS score gets worse, check for elements that resize after load. Common causes include banners that appear late, ads, or images without fixed dimensions. Setting width and height, reserving space for banners, and loading fonts properly all help stabilize layout.
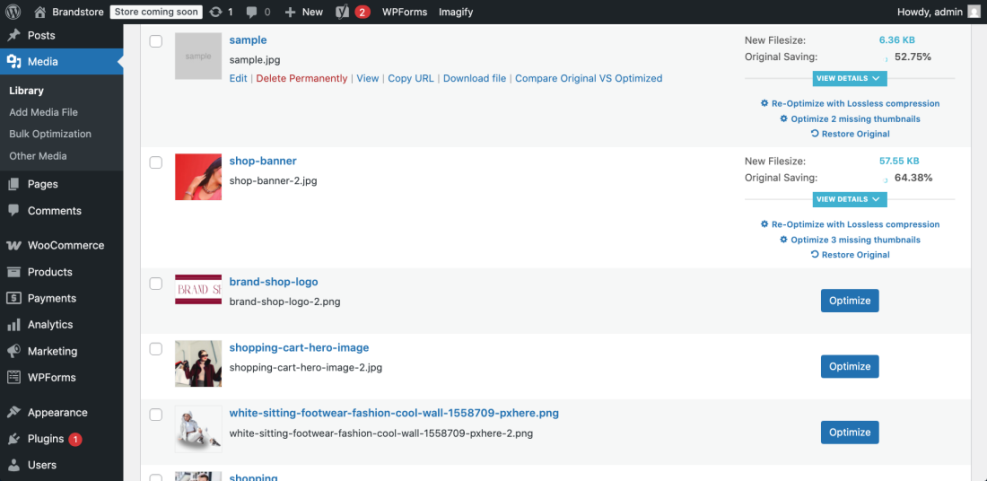
From the WordPress Dashboard, go to Media » Library and sort by file size to spot unusually large images introduced with the new design.
After you trim these heavy assets, retest the same URLs so you can see exactly how much each change helped.
Working With Developers and Stakeholders
Performance work often involves designers, developers, and site owners. Clear communication and shared reports make it easier to win support for changes that might slightly adjust the look to keep speed healthy.
How to Present Performance Findings
Create a short summary with three parts: what you tested, the key metrics, and what you recommend. Use simple charts or tables and keep technical terms brief. When people see clear before and after comparisons, they are more willing to approve follow up work.
When to Bring in Optimization Help
If you see repeated slowdowns from hosting or complex plugins, consider expert help. For example, you can point stakeholders to a dedicated WordPress speed guide and use it as a plan for deeper improvements after you finish measuring results.
Discuss hosting, caching, and plugin choices early in the redesign process so performance is a shared goal, not an afterthought.
WordPress Performance Conclusion
After a redesign, your job is to protect both the new look and the user experience. When you measure WordPress performance with the same tools, metrics, and URLs before and after launch, you can move from guesswork to clear, data backed decisions.
The next step is to build performance checks into every design cycle. Include speed testing in your staging, launch, and maintenance workflows so each future change stays fast. Over time, this habit leads to a site that feels modern, stable, and reliably quick for every visitor.
More WordPress Guides You Might Like
If you want to go beyond measurement and start improving results, these guides help you plan your next actions.
- WordPress Hosting Explained
- Best WordPress Caching Plugins
- Managed WordPress Hosting For Faster Safer Sites
- How to add keywords in WordPress without hurting
- WordPress performance tuning beginner guide
Use these resources as a roadmap to move from testing and measurement into full optimization and long term performance maintenance.